|
|
|
|
|
|
|
RStudio Shiny在R中轻松使用的Web应用程序
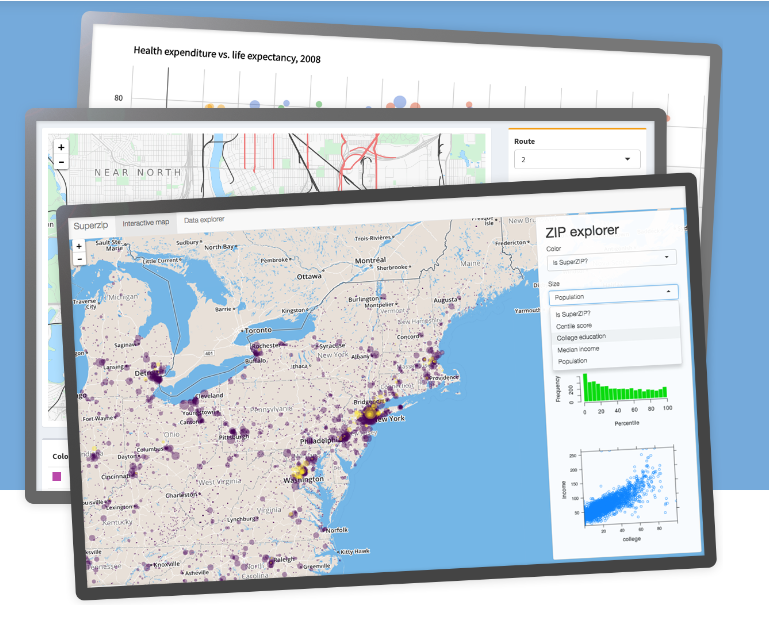
Shiny是一个开源的R程序包,它提供了一个简洁而强大的Web框架,用于使用R创建Web应用程序. Shiny可以帮助您将分析转换为交互式Web应用程序,您不需要掌握HTML,CSS或JavaScript知识。
想要建立自己的Shiny apps?
交互·分析·通信。
使用Shiny采用新颖,互动的方式来展现你的数据。使用户与您的数据和分析产生相互作用。 使用R可以做到这一切。
Shiny是R的一个程序包,可以直接从R中创建交互式Web应用程序。您可以在网页上托管单机app,也可以将其嵌入到R Markdown文档或构建仪表盘中。您还可以使用CSS主题,htmlwidgets和JavaScript操作来扩展Shiny apps。
Shiny app
Shiny apps编写方法简单。无需Web开发技能。
Google趋势指数

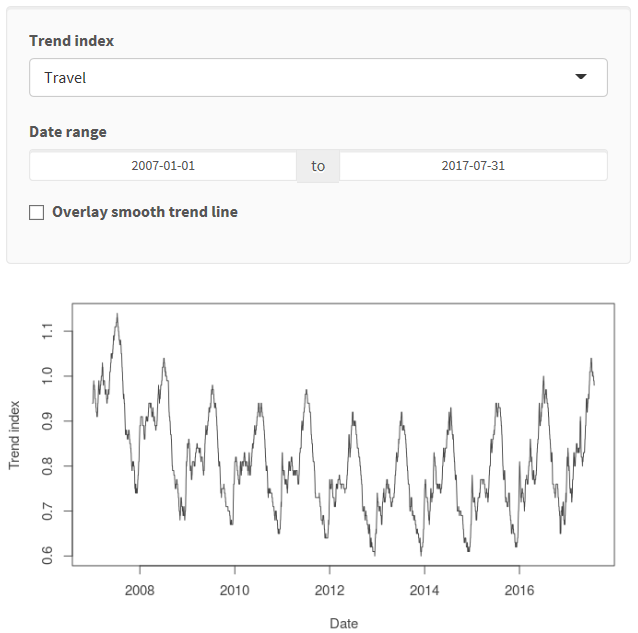
Google Travel Index可以追踪与航空公司,酒店,沙滩,西南部地区,拉斯维加斯,航班等相关的查询。索引在2004年1月1日设定为1.0,仅适用于美国的搜索流量。
描述
Shiny带有各种内置输入部件。使用极小部分的语法,就可以包含如app左侧所示的小部件:
#选择要绘制的趋势类型
selectInput(inputId = "type", label = strong("Trend index"),
choices = unique(trend_data$type),
selected = "Travel")
#选择要绘制的日期范围
dateRangeInput("date", strong("Date range"),
start = "2007-01-01", end = "2017-07-31",
min = "2007-01-01", max = "2017-07-31")
显示输出同样轻松简单:
mainPanel(
plotOutput(outputId = "lineplot", height = "300px"),
textOutput(outputId = "desc"),
tags$a(href = "https://www.google.com/finance/domestic_trends",
"Source: Google Domestic Trends", target = "_blank")
)
按照R中通常的方式创建您的绘图或表格,使其与调用相应的渲染函数无关:
output$lineplot <- renderPlot({
plot(x = selected_trends()$date, y = selected_trends()$close, type = "l",
xlab = "Date", ylab = "Trend index")
})
想知道我们如何创建左侧显示的Google Trend Index app?有关完整的源代码,请参阅下一个选项卡。
app.R
#加载包
library(shiny)
library(shinythemes)
library(dplyr)
library(readr)
#加载数据
trend_data <- read_csv("data/trend_data.csv")
trend_description <- read_csv("data/trend_description.csv")
#定义UI
ui <- fluidPage(theme = shinytheme("lumen"),
titlePanel("Google Trend Index"),
sidebarLayout(
sidebarPanel(
# Select type of trend to plot
selectInput(inputId = "type", label = strong("Trend index"),
choices = unique(trend_data$type),
selected = "Travel"),
# Select date range to be plotted
dateRangeInput("date", strong("Date range"), start = "2007-01-01", end = "2017-07-31",
min = "2007-01-01", max = "2017-07-31"),
# Select whether to overlay smooth trend line
checkboxInput(inputId = "smoother", label = strong("Overlay smooth trend line"), value = FALSE),
# Display only if the smoother is checked
conditionalPanel(condition = "input.smoother == true",
sliderInput(inputId = "f", label = "Smoother span:",
min = 0.01, max = 1, value = 0.67, step = 0.01,
animate = animationOptions(interval = 100)),
HTML("Higher values give more smoothness.")
)
),
# Output: Description, lineplot, and reference
mainPanel(
plotOutput(outputId = "lineplot", height = "300px"),
textOutput(outputId = "desc"),
tags$a(href = "https://www.google.com/finance/domestic_trends", "Source: Google Domestic Trends", target = "_blank")
)
)
)
# Define server function
server <- function(input, output) {
#子集数据
selected_trends <- reactive({
req(input$date)
validate(need(!is.na(input$date[1]) & !is.na(input$date[2]), "Error: Please provide both a start and an end date."))
validate(need(input$date[1] < input$date[2], "Error: Start date should be earlier than end date."))
trend_data %>%
filter(
type == input$type,
date > as.POSIXct(input$date[1]) & date < as.POSIXct(input$date[2]
))
})
#创建plotOutput函数所期望的散点图对象
output$lineplot <- renderPlot({
color = "#434343"
par(mar = c(4, 4, 1, 1))
plot(x = selected_trends()$date, y = selected_trends()$close, type = "l",
xlab = "Date", ylab = "Trend index", col = color, fg = color, col.lab = color, col.axis = color)
#仅当检查滤波器时才显示
if(input$smoother){
smooth_curve <- lowess(x = as.numeric(selected_trends()$date), y = selected_trends()$close, f = input$f)
lines(smooth_curve, col = "#E6553A", lwd = 3)
}
})
#引入趋势描述
output$desc <- renderText({
trend_text <- filter(trend_description, type == input$type) %>% pull(text)
paste(trend_text, "The index is set to 1.0 on January 1, 2004 and is calculated only for US search traffic.")
})
}
#创建Shiny对象
shinyApp(ui = ui, server = server)

准备好分享您所创建的应用程序了吗?
引入Shiny Web Apps Online
RStudio允许您以最适合的方式将shiny web应用程序和交互式文档进行联机。
针对Shiny应用程序,请考虑Shiny Server或Shiny Server Pro,它将企业级扩展,安全性和管理功能添加到基本的开源版本。
如果您希望我们托管您的Shiny应用程序,我们的一个shinyapps.io计划一定会为您做到这一点。
当您准备就绪时,RStudio Connect是您的团队在R中所创建的所有工作的全新发布平台。可以在方便的地点共享Shiny应用程序,R Markdown报告,仪表盘,绘图,API等。使用RStudio IDE的按钮发布,定期执行报告和灵活的安全策略,将数据学科的力量带给整个企业。
不想维护服务器?
在线分享您的Shiny应用程序!
使用shinyapps.io在几分钟内即可在Web上配置Shiny应用程序。
方便使用
部署Shiny应用程序会变得非常简单!您不需要拥有服务器,或者了解如何配置防火墙来部署和管理云中的应用程序。无需硬件,安装程序或年度采购合同。
安全
Shinyapps.io使用的是安全设计。每个Shiny应用程序都在自己受保护的环境中运行,并且访问会进行SSL加密。标准和专业计划可提供用户身份验证,防止匿名访问者访问您的应用程序。用户需要通过当前包括Google,GitHub或shinyapps.io帐户的受支持系统进行身份验证。
可扩展性
我们自己拥有IT团队,所以您不必在这方面费心。当您的Shiny应用程序和用户增加时,我们确保您的计算资源将轻松扩展。您还可以通过控制可用资源来调整应用程序的性能。这包括在给定实例中运行多个R进程的能力,以及添加其它实例以提高应用程序性能的能力。 Shinyapps可以进行扩展以满足任何工作量。
文档
如何使用shinyapps.io的相关说明,请参阅shinyapps.io用户指南。
Shiny有什么新功能?查看Shiny Dev Center,您可以在其中找到有关创建Shiny应用程序的文档,教程和示例。
社区支持
获得shinyapps.io帮助的最佳地点是是Shinyapps用户的邮件列表。
如果您在shinyapps上遇到困难,请随时去那里提问。
高级支持
具有基本版,标准版或专业版的订阅客户可以通过在RStudio支持网站上打开案例直接访问我们的技术工程师。时间为周一至周五的上午9点至5点(美国东部标准时间)。
京ICP备09015132号-996 | 网络文化经营许可证京网文[2017]4225-497号 | 违法和不良信息举报电话:4006561155
© Copyright 2000-2025 北京哲想软件有限公司版权所有 | 地址:北京市海淀区西三环北路50号豪柏大厦C2座11层1105室


![网络文化经营许可证京网文[2017]4225-497号](/f/image/20180509/20180509164113_9707.jpg)